

Quality Businesses Part 2: Finding Compounding Machines (High FCF Growth & ROIC)

"Compounding is the engine of wealth creation. Find businesses that are compounding machines—those that can take retained earnings and invest them at high returns. These are the businesses that make investors wealthy." – Mohnish Pabrai
Welcome to part 2 of our mini-series on identifying “Quality” companies.
In our previous blog we discussed the drivers of value and the following 3 key concepts:
Key Concept 1: The value to a shareholder is based on the Cashflows produced by the business.
Key Concept 2: Value is a function of Return on Invested Capital (ROIC) and Net Operating Profit After Tax (NOPAT) / Cash Flow Growth Rate
Key Concept 3: Value is only created where ROIC is higher than the cost of capital for the business.


Within this blog we will begin to discuss how to quantitatively analyse a business to ensure it is maximising the potential of these 3 concepts.
The Quality Filter
As a reminder our stock selection funnel process looks to use a series of filters to either include or exclude companies from our buy / watchlist.

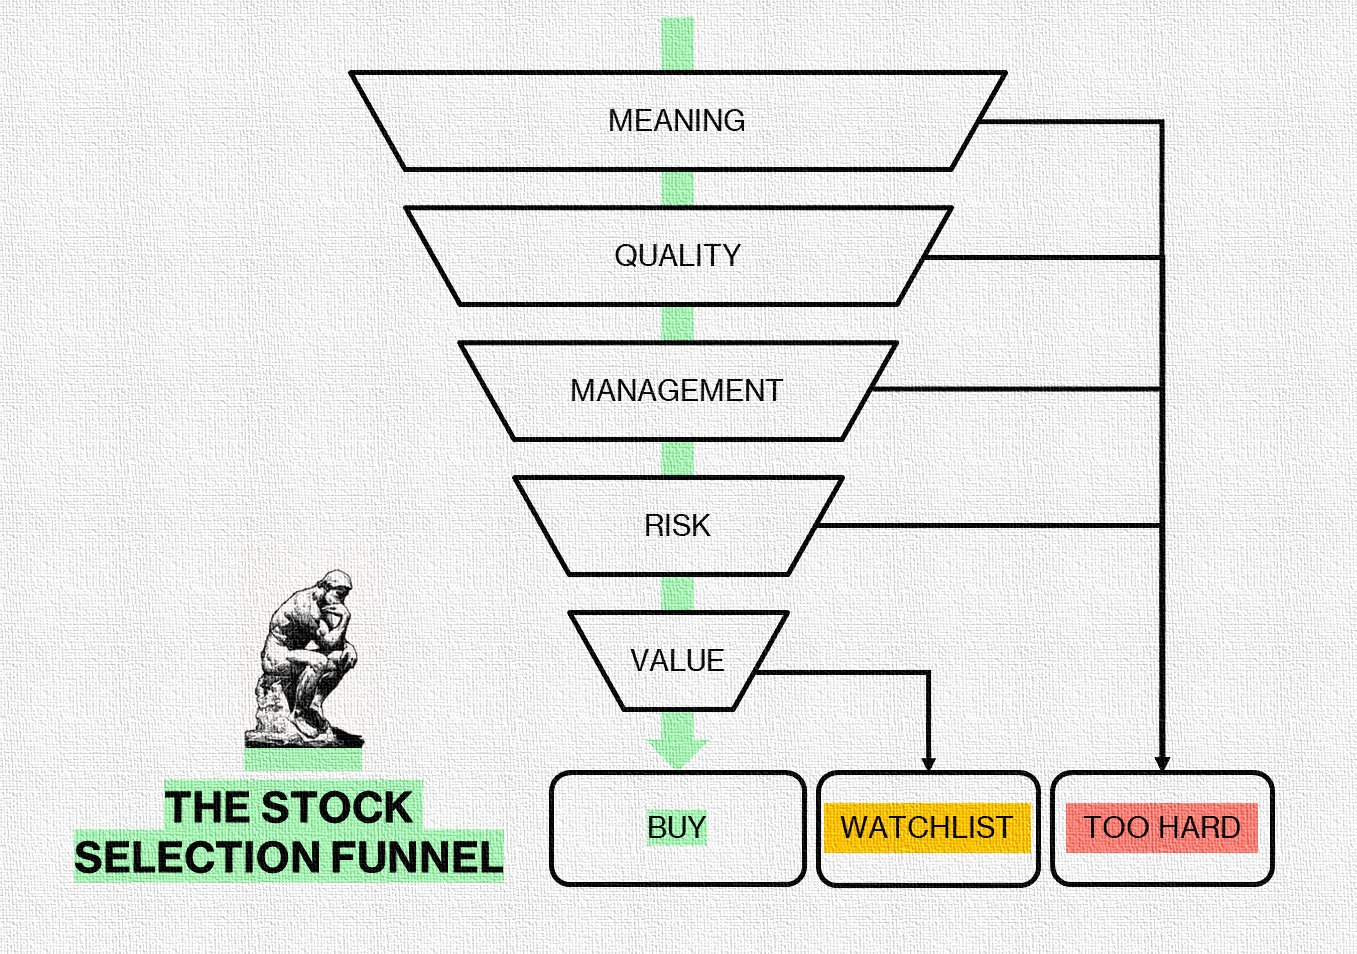
Once we are confident the business has meaning to us and sits within our circle of competence then the next most important filter is ensuring that the business has quality underlying fundamentals.
Quality: Focus on companies with strong competitive advantages and consistent performance.
Fundamentally a quality company is one which has the characteristics that can mean it can provide high levels of shareholder value over the long term.
Based on the key drivers of value it is clear that we should look for businesses with positive free cash flows, high levels of return on invested capital (Above the cost of capital) and high levels of growth. If we are also confident that these levels of return are durable and can be maintained into the foreseeable future, we can be sure we are on to a quality business.
For a company to be able to do this is must have a competitive advantage with significant barriers of entry (otherwise known as a MOAT).
"The most important thing [is] trying to find a business with a wide and long-lasting moat around it... protecting a terrific economic castle with an honest lord in charge of the castle." - Warren Buffett
To identify a quality company, we need to look at it both quantitatively and qualitatively. We will then link and compare the two to provide a holistic overview of the company.
In part 2 (This post) we will look for quantitative measures that indicate a company may have a competitive advantage. Given their importance in value creation both ROIC and Free Cash Flow per Share Growth are included in our analysis.
In part 3 we will also specifically look at Margin and Invested Capital / Capital Intensity as they make up ROIC and help us to get a better understanding of the business and what types of competitive advantages they have.
Then in part 4 we will then look at the business qualitatively to explain the numbers, its competitive advantage and assess its durability moving forwards:
We will first look at Industry Dynamics & Business Resilience to get a better understanding of the environment the business operates in and key factors that can impact the business.
Then we will attempt to identify any competitive advantages the business may have, assess their durability by reviewing barriers to entry and then ensuring we understand how the business will continue to deliver shareholder value into the future.
By identifying and validating that a company has a durable competitive advantage we can be confident that the business fundamentals are of high quality. Therefore, the business can deliver sustained shareholder value if managed correctly and any associated risks are properly mitigated. (Note: We will discuss each of these in future posts.)
In other words a compounding machine!
Now on to the Quantitative Analysis…
Free Cash Flow per Share Growth (Quantitative)
First and foremost a quality company should be making money.
Businesses make money by selling products or services, which generates revenue—the total amount they bring in. From this, they subtract expenses like wages, materials, and other costs to get net income, or profit. However, profit does not always reflect the actual cash available. To find how much cash a business has, we look at free cash flow. This is net income, adjusted by adding non-cash expenses (like depreciation) and subtracting cash spent on things like new equipment (capital expenditures). Free cash flow shows the cash a business has to grow, pay debts, or return to shareholders.
As shareholders we are therefore most interested in positive (and preferably growing) free cash flow!
"Free cash flow is one of the most important numbers for a company because it tells you how much money the company is generating that can be used to pay down debt, buy back shares, or invest in growth." – Peter Lynch
Analysing free cashflow is the first thing I do when looking at the fundamentals of the business. I will go to the income statement and cash flow statement to look for the following:
Top Line – Year on year revenue growth (Of at least 5%)
Bottom Line – Year on year net income growth (Of at least 5%)
Operating cash conversion ratio – Evidence that the business can convert the majority of its net income into Free Cash Flow. (As close to 100% as possible)
I find the easiest way to see these trends is to plot revenue, net income, and free cash flow graphically over a period of at least 10 years. This helps to really brings the numbers to life.
To illustrate the point, I will compare a high-quality company (Visa) with a not so high-quality company (General Electric). Note: I am using TIKR terminal to pull all of the data for the below.


It is easy to see from the graphs which has been the better performing company over the last 10 years:
Visa has steadily growing revenues and net income. We can also see that Free Cash correlates very closely to net income.
General Electric has declining revenues over the period. We can also see erratic net income which fluctuates from positive to negative across years. Free cash flow also does not correlate well with net income.
On this basis we can already see that Visa is providing greater shareholder value than General Electric and is likely a higher quality company.
To support this, it is also worth us checking earnings per share (or net income per share) and Free Cash Flow per share. This allows us to take into account stock dilution through share issuance or stock consolidation through share repurchases / buybacks. Ultimately, as shareholders of the company we are interested in the per share figures as this represents the net income / FCF flowing to us as shareholders. Over the long term our returns should highly correlate with the FCF per share growth rate.
Again, you can see a comparison of Visa and General Electric below:


Over the ten-year period share Visa has been regularly buying back shares and the number of shares outstanding has dropped from 2.5B in 2014 to 2.1B in 2013 (-16%). This had the effect of increasing EPS and FCF per share at a faster rate. Overall Visa had a compound annual growth rate (CAGR) of 15%.
General Electric also bought back a similar percentage at -13% which positively impacted the per share numbers. However this was outweighed by an overall decline in Cash Flow from the business. Overall General Electric had a compound annual growth rate (CAGR) of -16%.
To further enhance our analysis on Visa, it is worth looking at the linearity of the FCF per share growth. We can do this through plotting the FCF per share and performing an exponential regression analysis. The linearity for Visa comes out at 89% demonstrating a close correlation and low volatility in results. This helps to build the case for a durable competitive advantage and provide a foundation for valuing the business based on future cash flows. Note: More on this in blog posts!

Thinking back to the key concepts that drive shareholder value we now have fully covered Key Concept 1: The value to a shareholder is based on the Cashflows produced by the business and covered half of Key Concept 2: Value is a function of Return on Invested Capital (ROIC) and Net Operating Profit After Tax (NOPAT) / Cash Flow Growth Rate.
By now looking at Return on Invested Capital (ROIC) we will be able to fully cover key concept 2 & 3 …
Return on Invested Capital (Quantitative)
If a company is growing its revenue, net income, and free cash flow, we as investors need to know how it is doing this.
The most effective way for a company to grow is by increasing sales without a proportional increase in expenses. However, this is a rare feat. Typically, companies must invest to drive growth, which often requires funding for:
New assets to scale production.
Research and development (R&D) to innovate products and services.
Marketing to expand customer reach.
Human resources to support expansion.
Strategic acquisitions to accelerate market presence.
These investments are necessary for sustainable growth, but they also demand careful resource management to ensure profitability.
What we are really interested in is if the company is getting good bang for its buck when it comes to these investments. Or put another way is the company getting a good return on sales and profit growth for the amount it is investing to produce that growth?
This is where Return on Invested Capital comes in, which I like to think of the companies interest rate. If I had to pick only one business metric it would be the return on invested capital. The higher the ROIC the better and we are looking for companies with an ROIC of at least 15%.
Why an ROIC of 15%?
As you will remember from our key concepts of shareholder value creation Key Concept 3: Value is only created where ROIC is higher than the cost of capital for the business.
The typical range for weighted average cost of capital (WACC) is 7% to 12% for most companies depending on factors like industry, risk profile, and capital structure. It is best for us to be conservative to ensure there is a gap between the ROIC and the WACC of the company. We have therefore chosen 15% which will usually provide a positive delta of at least 3% and any growth in free cash flow should be value accretive.
Note: When we discuss valuation in a future blog post we will look at calculating the specific WACC for a given business.
"For a business to grow and create value, it must generate a return on capital that exceeds its cost of capital. Otherwise, growth destroys value rather than enhances it." - Aswath Damodaran
To analyse ROIC I again like to look at it graphically. In the below chart I have plotted out ROIC for Visa and General Electric for the last 10 years.
To demonstrate the point, I have also shaded 3 areas of the chart:
Green: ROIC is greater than 15%. Investment & Growth is likely value accretive.
Amber: ROIC is between 7% to 15%. This is within the range of WACC for the business and growth will likely be neither value accretive nor value destructive.
Red: ROIC is below 7%. Investment & Growth is likely value destructive.
When studying this chart, we are looking for ROIC to be consistently above 15%. We are also looking for any trends in ROIC. A slowly declining ROIC might represent a deteriorating competitive advantage which is not something we want to be buying in to.
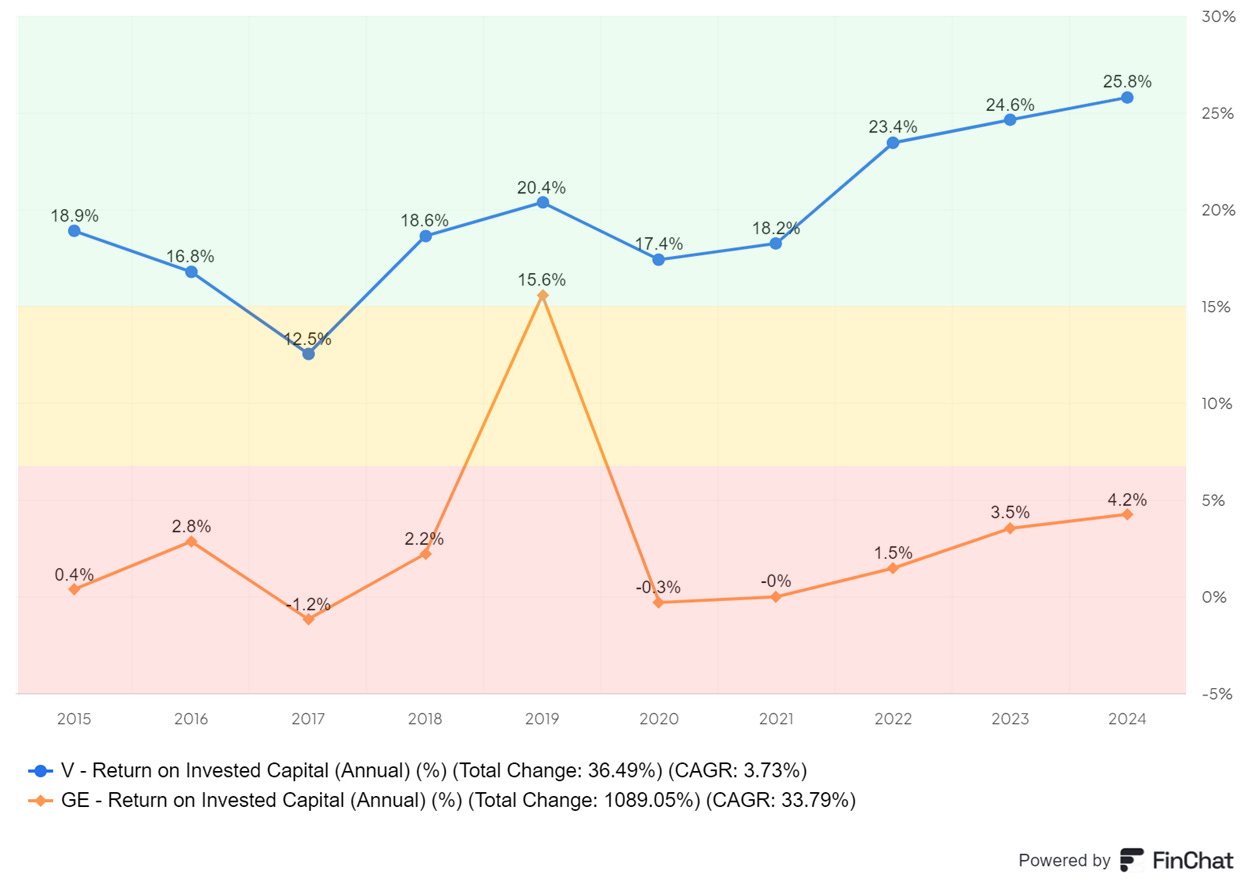
From the chart it is clear that Visa’s ROIC is consistently above 15% (Apart from on year) and in some years exceeding it by more than 10%. Any growth in revenues is going to be value accretive! We can also see that the ROIC is generally on a upward trend which is great.
General electric on the other hand has consistently achieved an ROIC below 7% (Again apart from on year). They are destroying capital by investing!
"It's not enough to invest in companies that generate high returns on capital. What’s crucial is that they can continue to generate these high returns, while the cost of capital remains lower, allowing compounding to work in your favor over time." – Joel Greenblatt
At this point we have already done enough to show that Visa has been a higher quality company than General Electric over the last 10 years.
It is now our job to try and dig deeper into the reasons behind the higher ROIC of Visa. This is very instructive and will help us later on when we start to look at the business more qualitatively.
Join us in part 3 of the mini-series on identifying quality companies where we will discuss the Margin, Invested capital and the impact they have on ROIC.
Disclaimer
As a reader of Focus Invested, you agree with our disclaimer. You can read the full disclaimer here.