

Quality Businesses Part 4 - Invested Capital Explained

"Reinvestment of earnings is the key to long-term returns. The best companies have management teams who know how to allocate capital efficiently to create future value." - Philip Fisher
Welcome to part 4 of our mini-series on identifying “Quality” companies.
In our previous instalments we covered:
The key drivers of shareholder value creation
We then looked a how we build these into our filtering process by looking for quality companies with growing free cash flow and high Returns on Invested Capital (ROIC)
How profit margins impact ROIC

This mini-series will progress as follows:
Part 4 (This Section): A deep dive into invested capital.
Part 5: Wrapping it all up with qualitative analysis.
When it comes to invested capital there are 2 main considerations to take into account when analysing he quality of a company:
Low Capital Requirements: We are looking for business that do not need to invest significant capital to grow i.e. they have a low capital intensity (and a higher ROIC as a result!).
Investment Opportunities: We are looking for businesses that can deploy additional capital into operations at those high rates of return indefinitely.
By combining both a high ROIC and the ability to deploy additional capital at high rates the magic of compounding can truly start to take effect. This is how you drive sustainable growth in free cash flows and therefore increase shareholder value over the long term.
Let’s take each in turn…
1. Low Capital Requirements (Capital Intensity)
As a reminder, invested capital consists of two main components: working capital and fixed capital. Working capital represents the funds a company uses for its day-to-day operations, such as managing inventory, receivables, and payables. Fixed capital refers to long-term assets like property, plant, and equipment (PP&E) that are necessary for producing goods or services. Together, these two elements form the total capital a business invests to generate returns and drive growth.
Ideally, we are looking for businesses that do not need much of either working or fixed capital to grow.
The lower the invested capital required to generate a given level of profit, the higher the ROIC of the business.
Let’s look at working capital and fixed capital in turn…
Working Capital
Analysing working capital is crucial for understanding:
A company’s operational efficiency
A company's short-term financial health
For the purposes of exploring ROIC we are more interested in operational efficiency, but we will revisit short term financial health when we look at the “Risk” filter in a future blog post.
To review operational efficiency we will primarily look at working capital turnover and Cash Conversion Cycle.
Working capital turnover is a measure of how effectively a company uses it working capital to generate revenue. Is calculated by dividing total revenue by the average working capital for the period.
A higher number indicates the company is efficiently using its working capital to generate sales.
I like to use Working capital turnover when analysing ROIC as it uses total revenue and therefore excludes the effect of margin on the analysis which we have already investigated. However, combining a high working capital turnover with a high margin means more profits!
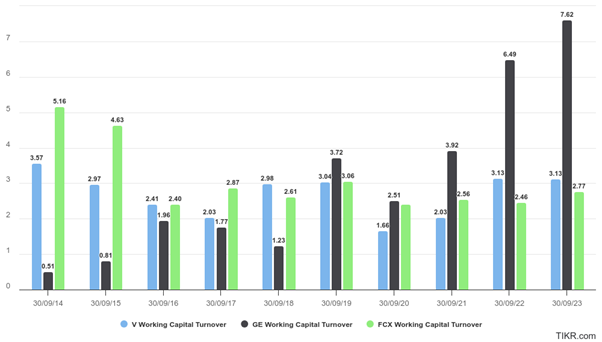
Below I have plotted the working capital turnover ratio for the last 10 years. For illustrative purposes I have included an additional company Freeport-McMoRan (FCX), a mining company, into the analysis.
So, what are we looking for when analysing working capital turnover:
There are no hard a fast rule here, but any working capital turnover ratio above 2 can be considered good.
As always, we are also interested in any trends in the numbers. Increasing numbers can indicate an improvement in operational efficiency.
Note: this comparison is even better if you can use operating working capital instead of working capital. Operating working capital focuses on a subset of specific components directly tied to the company’s operations. It looks to exclude non-operating assets such as excess cash and marketable securities as well as certain types of interest-bearing debt. Discussion on this is beyond the scope of this article and to calculate it would require some digging into the notes of the financial statements. (This is the kind if extra work that needs to be done before investing!)
But for now, we are confident that Visa has a good working capital turnover, and it is remaining relatively stable. Notably GE started off poorly in 2014 but has been steadily improving its working capital turnover in recent years which would be worth investigating in more detail. FCX has been on a slight downward trend for the period, but the absolute numbers are still ok.
To help explain the numbers we can go one step further by looking at the Cash Conversion Cycle (CCC) for each business.
The CCC is a measure of how long it takes for a company to convert its investments in inventory and other resources into cash from sales. A shorter cycle means the company quickly recovers cash, while a longer cycle can indicate inefficiencies in managing working capital.
Generally, businesses with a shorter CCC have reduced working capital requirements compared to businesses with a longer CCC. This is how CCC looks for each business:
Visa: Visa's CCC is generally quite low or even negative, given the nature of its business. Credit card networks like Visa typically receive payments from merchants faster than they pay banks, resulting in a favourable cash flow situation.
General Electric: GE's CCC varies across its divisions, but due to its industrial and manufacturing operations, the CCC tends to be higher. Historically, its CCC has ranged between 80 to 100 days, reflecting the need for better working capital efficiency.
Freeport-McMoRan: FCX, a large mining company, has a notably long CCC. Mining operations require significant capital tied up in inventory (materials in various stages of production), which leads to a CCC that can range around 270-285 days.
The correlation between Working Capital and CCC is not perfect, but it is worth digging deeper into the company’s reports to explain the numbers and get a better sense for how each business operates.
However, for our purposes working capital is similar for each business and does not appear to be the determining factor in the differences in ROIC.
Fixed Capital
Analysing fixed capital is crucial because it represents long-term investments in assets like property, equipment, and infrastructure, which are key to sustaining and expanding a business's operations. It helps assess a company's capacity to scale production and maintain efficiency, which directly impacts profitability and return on investment.
To do this we will look at fixed asset turnover.
Fixed asset turnover is a measure of how effectively a company uses it working capital to generate revenue. It is calculated by dividing total revenue by the average fixed assets for the period.
You can see that this takes the same format to working capital turnover and we are similarly looking for:
A fixed asset turnover ratio of at least 2
Any trends in the numbers. Improving numbers indicates the business is more efficiently using it assets.

From the chart above it is clear this is where Visa really shines as a business and shows exceptional efficiency with fixed asset turnover ranging from 10-15x. Both GE and FCX are more capital intensive than Visa. GE is still fairly good with most years being above 2. Notably it has been improving in recent years. FCX on the other hand has always had a ratio below one. This means their total revenues each year are below that which they have invested in fixed assets.
To support this analysis, it is useful to look at number of related metrics which can be seen in the below table:
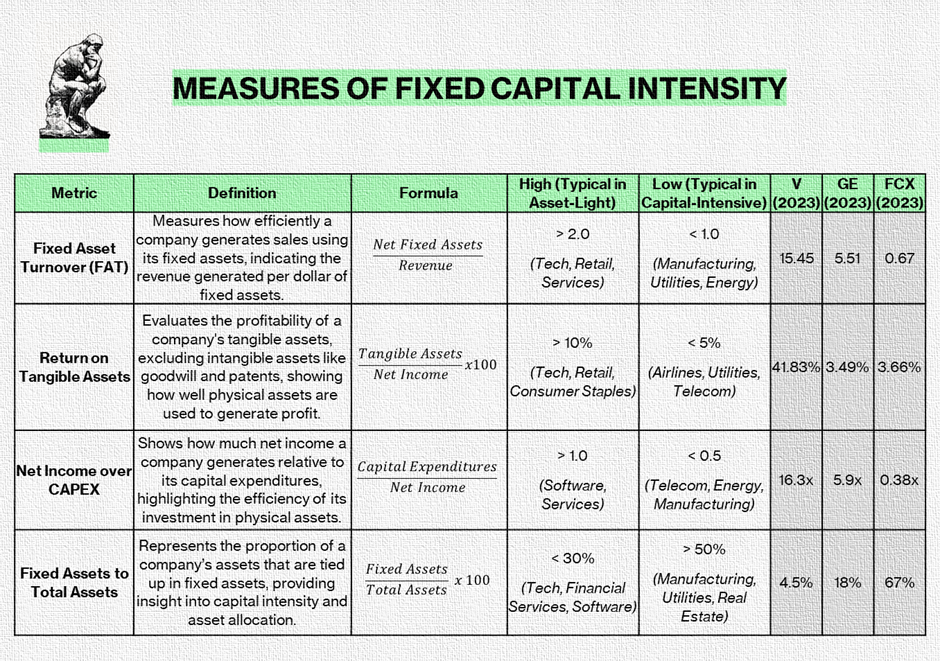
To summarise the above:
Each metric is pointing towards Visa being a capital light and efficient business. This is helping to keep the level of invested capital down and maintain a high ROIC.
GE has a decent Fixed Asset Turnover (based on revenues), but we can see the Return on Tangible Assets (Based on net income) is low. This is due to the lower margins of GE.
FCX performs poorly on all fronts and the business is very capital intensive. The particularly alarming metric is that they are needing to invest more in CAPEX than net income with a net income to CAPEX ratio of 0.38x. This is never a great place to be in!
From looking at Working Capital and Fixed Capital together we can see that Visa has a low invested capital requirement which is also contributing to its high ROIC!
Note on capital light businesses: When evaluating capital-light businesses, an ROIC above 50% may warrant closer scrutiny. Such high returns could indicate that the business is not capitalizing R&D expenses, which can inflate ROIC artificially by underreporting capital investments. It's crucial to investigate how the company treats R&D or other major expenses in its financial statements before making an investment decision, as this can provide a clearer picture of true capital efficiency and profitability.
2. Investment Opportunities
The second point to consider when looking at invested capital is the ability of the business to deploy additional capital (i.e. increase Invested Capital), whilst maintaining High ROIC levels to fully maximise Net Operating Profit After Tax (NOPAT) and therefore cash flows.
Doing this over the long term lets the fly wheel of compounding take hold as profits are reinvested into the business and generate incremental returns. This is the definition of a quality compounding machine and results in significant shareholder value.
“Over the long term, it’s hard for a stock to earn a much better return than the business which underlies it earns. If the business earns 6% on capital over 40 years and you hold it for that 40 years, you're not going to make much different than a 6% return – even if you originally buy it at a huge discount.” - Charlie Munger
In practice this can’t go on forever and eventually the company will have to make one of the following capital allocation decisions:
Invest at Lower ROIC levels: The business starts to invest capital at lower returns. Remember this will still be value accretive if ROIC > WACC but the compounding effect will slow.
Pay Down Debt or Hold cash: The business can hold profits on the balance sheet as excess cash. However, this will not count as operating cash and therefore won’t increase invested capital. This won’t provide any incremental value to shareholders beyond the benefits of reducing interest expenses and improving the balance sheet.
Buy Back Shares: The business can buy back a portion of the shares therefore increasing the free cash flow available to the remaining shareholders. This is great for a quality business, but it is only value accretive if the price is below intrinsic value.
Pay a Dividend: Return excess cash flow to shareholders in the form of dividends. Now it is not necessarily a terrible thing to be paying out dividends, but it can indicate the business is running out of investment opportunities.
Ideally, we looking for businesses that are able to plough profits back into invested capital at high rates of return instead of resorting to one of the above.
This is best demonstrated through an example. The below diagram shows the difference in returns for a business that reinvests all its profits back into invested capital (Company A) vs one that pays it all out as dividends (Company B).
Both businesses start with invested capital of $100 and have constant ROIC of 25%.
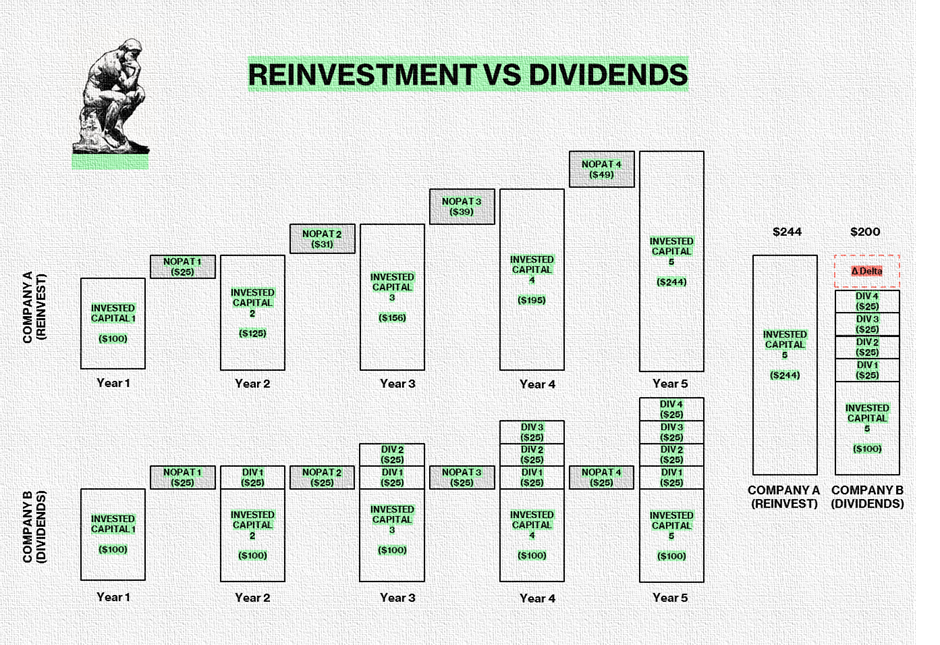
With company A re-investing in the business, it is letting compounding take hold and the CAGR over the period is 25% (Equal to ROIC). The final value to shareholders in year 5 is the invested capital at $244 dollars.
Company B still does very well with a 25% ROIC. However, with all profits being paid out as dividends the CAGR over the period suffers and is only 19%. The CAGR will only reduce further the longer this goes on. The final value to shareholder in year 5 is the original invested capital plus the dividends received over the period totalling $200.
Granted this does not consider the fact the dividends can be reinvested. However, to achieve the same result as company A, shareholders of company B would need to find opportunities with a 25% CAGR. A tall order!
From the above it is clear for a high-quality business, with a high ROIC, it is desirable to reinvest as much profit as possible back into operations.
Identifying Businesses Struggling to Find Opportunities to Re-Invest
As can be seen in the above example If a company has been growing FCF at or near its ROIC over an extended period it indicates it is fully utilising its investment opportunities. Therefore, over the long term FCF CAGR should be roughly equal with ROIC over the period.
To analyse this, we should:
First compare FCF CAGR and ROIC over a number of periods
If there is a difference between the two then we should look to explain the differences by looking at how the business has been investing its capital back into operations or not as the case may be.
Let’s look at Visa as an example. In the below I have mapped ROIC against EPS growth rate for a number of periods. Note: I have used EPS growth rate as a proxy for FCF / Share growth rate as the numbers are more readily available (Remember operational cash conversion to free cash flow is close to 100% for Visa).

As we can see the EPS growth rate on average is below the ROIC for Visa across multiple periods. Let’s explore the different capital allocation decisions the business can make and see if they explain the reason for the difference:
Invest at Lower ROIC levels:
There is no evidence that Visa are doing this. ROIC has actually been increasing in recent years.
Reason for Difference? - No
Pay Down Debt or Hold cash:
There have been no significant debt pay down in the period. Cash has increased in line with EPS growth at around 14% CAGR. This suggests most of the cash is operating and therefore included in invested capital. If some of this is excess cash (non-operating) then this could be marginally contributing to the lower EPS CAGR.
Reason for Difference? - Possible minor effect dependent on operating vs excess cash
Buy Back Shares:
Visa buys back around 2% of its shares each year, boosting EPS growth by reducing the number of shares outstanding. However, these buybacks don't increase the company's invested capital or improve operational efficiency, meaning they have no direct effect on ROIC.
Reason for Difference? -The effect this has is dependent on price the shares are purchased vs the intrinsic value of the stock. We will discuss this in more detail when we cover capital allocation in a future blog on the “management” filter. But for now:
Below Intrinsic Value: Buybacks add value, narrowing the ROIC-EPS delta by boosting EPS growth.
At Intrinsic Value: Buybacks are neutral, and the gap remains driven by dividends or reinvestment decisions.
Above Intrinsic Value: Buybacks destroy value, widening the ROIC-EPS delta because the overpayment leads to inefficient EPS growth.
Given this requires a view of the intrinsic value of the stock when the shares were bought this is complex to estimate. For now, let’s assume that the sales were at or near intrinsic value therefore having minimal effect.
Pay a Dividend:
To analyse dividends, we look at the payout ratio which tells you the percentage of profits that are paid out in the form of dividends. Visa has on average paid out 22% of its earnings in the form of dividends. This is 22% that is not being reinvested into invested capital.
Reason for Difference? - Significant effect. EPS growth rate should be approximately 22% behind ROIC. We can see this roughly play out in the numbers.
From the above we can see that Visa is not reinvesting all of its capital back into the business and is paying 22% back as dividends.
This means they are still reinvesting a healthy 78% back into the business at high rates of return either through investing in operations or share buy backs.
Visa is a large mature company and inevitably it will not be able to compound FCF at 15 to 20%+ (aligning with its ROIC) rate indefinitely. However, current growth rates are above the average of the market and with ROIC increasing in recent years we are also seeing an increase in CAGR.
The dividend payout ratio and share buy backs are something we should watch moving forwards. If they start to increase it is likely Visa is struggling to find suitable additional investment opportunities at scale. At this point growth will slow but there should be a solid dividend that a shareholder could reinvest back into more shares or other opportunities.
To understand this in more detail qualitative analysis and a review of capital allocation is required.
To summarise Visa has plenty of opportunities to reinvest but paying a dividend and share buybacks indicate the business is unable to redeploy all its capital back into operations and represents a slight drag on overall growth. However, shareholders are still getting market beating EPS/FCF growth and realising value through dividends and share buy backs.
Bringing it all together – Impact on Share Price
In the last 4 blog post we can have looked at the fundamentals of both Visa and GE. Our hypothesis is that Visa is a much higher quality than GE. Let’s see how this has played out with the share price of the 2 companies.
Visa:
Growing revenues, net income and cashflows
Growth is a consequence of a high ROIC (Which is significantly higher than their WACC)
It appears like the high ROIC is primarily a combination of being a high margin business with pricing power and a capital light business model.
Visa is also able to reinvest most (~78%) of these profits back into the business to kick in the magic of compounding.
Visa is therefore generating a great deal of shareholder value. Over the long term the share price follows business fundamentals and shareholder value (CAGR of 16.2%):

General Electric:
Declining and erratic net income which fluctuates from positive to negative across years. Free cash flow also does not correlate well with net income.
ROIC is consistently below WACC which is destroying shareholder value.
ROIC is low due to low margins and a more capital-intensive business.
We did not cover this in detail but in some years, GE is paying out more in dividends than it is earning and therefore not reinvesting in the business!
Over this 10-year period GE’s fundamentals have not been great, and this plays out in the share price over the period (CAGR of -1.3%):

It is clear which has been the winner over the last 10 years.
Remember over the long term the share price of the company aligns with the business fundamentals.
"In the short run, the market is a voting machine but in the long run, it is a weighing machine." – Benjamin Graham
Conclusion
By assessing Free Cash Flow per Share Growth, Return in Invested Capital, Margin and Capital Intensity we now have a view on whether the numbers indicate there is a competitive advantage.
It is now our task to validate this competitive advantage and assess its durability into the future through qualitative analysis.
By combing through the numbers, we will already have a good understanding of the drivers of value which will help to guide our analysis.
In part 5 of this mini-series on quality we will look at the qualitative analysis required to identify and assess a company’s competitive advantage.
Disclaimer
As a reader of Focus Invested, you agree with our disclaimer. You can read the full disclaimer here.